Learn some basic resources to help investigate failed workflows on Terra. This isn’t a guide for solving all errors, but it can help diagnose failed submissions. Descriptions of more complicated errors are always welcome on the Terra Forum, where our team is happy to help.
Overview
Workflows fail for many different reasons. If you're lucky, you have the wrong inputs plugged into the configuration, which is typically fast to fail and fast to fix (to learn how to avoid these sorts of errors, see How to configure workflow inputs). More complex errors come from the workflow code: bugs, or limitations in your analysis software package. And of course, you can fall victim to transient errors when something goes wrong on Google Cloud itself (even giants sometimes stumble). The information below will help you as you drill down to find the root cause of more complex errors.
At this point, we assume you have a workspace set up with a data table and workflow configuration loaded. You’ve launched your workflow, but your submission has failed. Don’t despair! Information in the Job History and Job Manager can help you get your workflow up and running.
To troubleshoot a failed workflow, start with high-level information about the workflow submission and work your way down to workflow- and task-level logs.
What to do if your workflow seems to be stuck or stalledIf
your workflow's status does not progress from "submitted" to "running," or
takes longer than expected to run, you may be up against a Google Cloud resource
quota. See
How to troubleshoot and fix stalled workflows
to learn how to solve this issue.
What's going on behind the scenes?For general information about monitoring submissions,
see
Overview: Job History (monitor and troubleshoot).
To understand what's happening behind the scenes when a
workflow is running, see
How the workflows system works.
Step 1: Check high-level submissions status
Your workspace's Job History tab lists all past workflow submissions.
Clicking on one of these submissions reveals more information about each workflow in the submission, including its high-level submission status (queued, running, done, a red triangle, etc.), workflow id, and error messages.
This page will help you identify a failed submission. To figure out why it failed, you need to dig deeper.
What to do if your workflow failed immediatelyIf
your workflow failed right when you submitted it, the problem is almost certainly
that Terra could not find an input file. That can happen for a couple of
reasons:
1. If you are using inputs from a data table, the column name
that you entered in the workflow's inputs section may not match the column's
name in the data table
2. If the file is stored outside of your workspace, you may
not have access to the bucket where the data is stored (or your authorization
link has expired)
For additional guidance, please see
Step 3: Specify inputs from a table
in
How to configure workflow inputs.
Step 2: Check workflow-level status
If you can't find an obvious problem with the submission, you can look for clues about each workflow within the submission. The Job History page for a particular submission lists each workflow's status (failed, queued, etc.), error messages, and links to more information in the Job Manager, the Workflow Dashboard, and the execution directory.
Submission-level details in Job History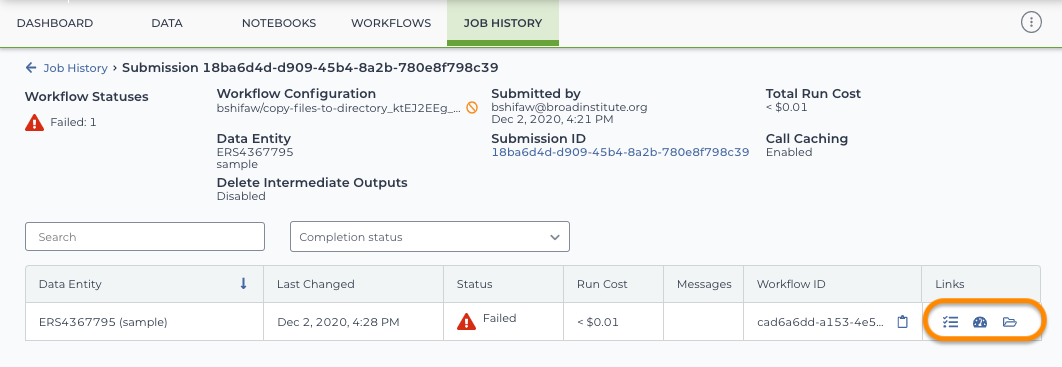
For more detail about a particular (failed) workflow, select one of the three icons at the right.
What to do if you don't see these iconsIf your job failed because it never even started (for example, because Terra could not find your input files), you won't see the job manager, dashboard, and execution directory icons in the "links" column. If this happens, follow the steps in the tip box in Step 2 to check that you correctly specified the file input and that you have access to the file.
Step 3. Check workflow details in the Job Manager
What to do if Job Manager won’t loadJob Manager may fail to load if your job produced huge amounts of metadata. In these cases, skip to the Workflow Dashboard (below).
The Job Manager (the checklist icon in the "links" section of the workflow's Job History summary) is your go-to location for a more thorough breakdown of how your workflow was run. Here you can find information about each individual task in the workflow, including
- Error messages
- Links to log files, Google Cloud execution directories, and Compute details
- A timing diagram.
Check the following for clues by clicking on or hovering over the appropriate icon.
|
|
Error messages: Can help identify and investigate which task failed. See below for examples of error messages often found for failed workflows. You can see Error messages (listed by task) in the Error tab (as above), or by hovering over the triangular error icon in the Errors card. |
|
|
Backend log: The backend log is a step-by-step report of how each task within the workflow was executed (i.e., Docker setup, localization, stdout from tools run within the command block of the task, and finally, the delocalization and Docker shutdown steps. Click on this icon in the Errors card to view the log. |
|
|
Execution directory: Includes task-level details and generated outputs for a particular workflow within your submission. Found on Google Cloud console, it is where you can view or download stderr, stdout, and backend logs for each task within the workflow. |
|
|
Compute details: Information on the workflow at the Google Pipelines worker level, including timestamps for the execution of worker tasks and VM configuration information. Use this section to understand or validate the configuration of your worker VM (memory, disk size, machine type, etc.). Or, check this section if you suspect your workflow failed due to a transient Google issue. Note: This information is only available for 42 days after the pipeline (VM) started. This is a Google lifecycle policy and there's no workaround to retrieve the data after 42 days. |
Common Batch error messages
The message displayed under Failure Message isn't always short and sweet, and, if interpreted incorrectly, will lead you down the wrong debugging path. Instead, use the message to identify and investigate which task failed.
To learn more, see Google Batch troubleshooting documentation, especially task failure exit codes (should be in logs).
Below are some common errors. Click to expand each and learn its possible meaning.
Not all of these errors have a straightforward solution, so if you're having trouble diagnosing your error get in touch with Terra's support team so the team can help you through the message.
-
What you'll see in the statusEvents field
Task state is updated from PRE-STATE to FAILED on zones/ZONE/instances/INSTANCE_ID due to Spot Preemption with exit code 50001.
What happened
This issue occurs when a Spot VM for the job is preempted during run time.
Solution
To resolve the issue, do one of the following:
- Retry the task either by using automated task retries or manually re-running the job.
- To guarantee there is no preemption, use VMs with the standard provisioning model instead.
-
What you'll see in the statusEvents field
The following issue appears in the statusEvents field for a job
Task state is updated from PRE-STATE to FAILED on zones/ZONE/instances/INSTANCE_ID due to Batch no longer receives VM updates with exit code 50002.
What happened
This issue occurs when there is a timeout in the backend that caused Batch to no longer receive updates from a VM for the job. Unfortunately, many hardware failures or software failures can cause a VM to be unresponsive—for example, a VM might crash due to a temporary host event or insufficient resources.
Solution
- In case the issue is temporary and resolves itself, retry the task either by using automated task retries or manually re-running the job.
- If the issue persists, identify and resolve what is causing the VM to be unresponsive by following the step-by-step instructions in Google documentation.
-
What you'll see in the statusEvents field for a job
Task state is updated from PRE-STATE to FAILED on zones/ZONE/instances/INSTANCE_ID due to VM is rebooted during task execution with exit code 50003.
What happened
This issue occurs when a VM for a job unexpectedly reboots during run time.
Solution
To resolve this issue, retry the task either by using automated task retries or manually re-running the job.
-
What you'll see in the statusEvents field
Task state is updated from PRE-STATE to FAILED on zones/ZONE/instances/INSTANCE_ID due to tasks cannot be canceled with exit code 50004.
What happened
This issue occurs when a task reaches the unresponsive time limit and cannot be cancelled.
Solution
To resolve this issue, retry the task either by using automated task retries or manually re-running the job.
-
What will you see in the statusEvents field
Task state is updated from PRE-STATE to FAILED on zones/ZONE/instances/INSTANCE_ID due to task runs over the maximum runtime with exit code 50005.
What happened
This issue occurs in the following cases
- A task's run time exceeds the time limit specified in the maxRunDuration field
- A runnable's run time exceeds the time limit specified in the timeout field
To identify specifically which time limit was exceeded, view logs for the job and find a log that mentions the 50005 exit code. The textPayload field of this log indicates where and when the time limit was exceeded.
Solution
To resolve the issue, attempt to verify the total run time required by the task or runnable that exceeded the time limit. Then, do one of the following.
- If you only occasionally expect this error, such as for a task or runnable with an inconsistent run time, you can try to recreate the job and configure it to automate task retries to try to increase the success rate.
- Otherwise, if the task or runnable consistently and intentionally needs more time to finish running than the current timeout allows, you can try to restructure your workflow to divide the work among multiple tasks. If this isn't possible, please add a description of your use case and upvote this feature request.
-
What you'll see in the statusEvents field
Task state is updated from PRE-STATE to FAILED on zones/ZONE/instances/INSTANCE_ID due to VM is recreated during task execution with exit code 50006.
What happened
This issue occurs when a VM for a job is unexpectedly recreated during run time.
Solution
To resolve this issue, retry the task either by using automated task retries or manually re-running the job.
Backend Log
If it's not immediately obvious what failed, the best sources of information are log files.
Logs provide a step-by-step report of actions during the execution of the task. These details include information about Docker setup, localization (the step of copying files from your Google bucket into the Docker container), stdout from tools run within the command block of the task, and finally, the delocalization and Docker shutdown steps.
If there were problems with any of these steps, you will see them in the backend log.
Before July 2025, logs were saved as files to your workspace bucket. From the Job Manager, when you clicked on the task's cloud icon, you would preview this log file in the UI, or click a link to view the file to the Google Cloud console.
As of July 2025, when you click the cloud icon from Job Manager, you will access logs through Google Cloud's Logs Interface. This experience reduces clutter in your workspace bucket, is more scalable, and provides a more robust search experience.
Please note that the default retention period for logs in this interface is 30 days.
Cromwell upgraded to using Google Cloud's Batch API in June 2025, and this new API adds batch_agent_logs in addition to batch_task_logs that you are familiar with. You can ignore the batch_agent_logs when troubleshooting, and if you prefer to remove them you can do by searching for "batch_task_logs". You can add additional search terms, such as "error" to help you troubleshoot issues.
If you'd like to do advanced querying of your logs, you can click the expand icon to open Logs Explorer. This tool offers its own query language and the ability to look across logs in your entire Google Project (learn more in their documentation).
If your log stopped abruptly Some log files seem to stop abruptly without reaching the delocalization stage. This is almost certainly because the task has run out of memory. We recommend retrying with more memory to see if your job gets farther. See Out Of Memory Retry to learn more about how to configure your workflow to immediately retry certain tasks if the only error was to run out of memory.
Execution directory
The execution directory is the file in your workspace bucket that contains the task-level details and generated outputs for a particular workflow within your submission. For example, did you run a workflow on two different samples, and one failed while the other succeeded? Access the execution directory to help find a solution for the one that failed.
To learn more, see Overview: Execution directory.
Compute details
You can find compute details by clicking info icon (a circle with an "i" in the middle) from your task listed in Job Manager. This displays information on the workflow at the Google Pipelines worker level, including timestamps for the execution of worker tasks and VM configuration information. Use this section to understand or validate the configuration of your worker VM (memory, disk size, machine type, etc.). Or, check this section if you suspect your workflow failed due to a transient Google issue.
Timing diagram
This is a visual representation of what Terra did as it ran the workflow - how much actual clock time was spent on commands within each task. It can help you understand what to look into further, especially if any part took much longer than expected.
Alternate Step 3: Workflow Dashboard (middle icon)
If Job Manager fails to load (e.g., if your job produced huge amounts of metadata), you can access much of the same information in the Workflow Dashboard.
The
Workflow Dashboard includes 1)
error messages
and 2) links to the
Job Manager
(above) and the
Execution directory
(see section below).
Remember - when troubleshooting, head to the Job History tab and check the stdout, stderr, and task log files for your failed task.
If there isn’t a stdout or stderr file, use the task log and the message explanations in this document to help solve the problem. Of course, if you have trouble with Terra troubleshooting, ask your question on the Terra Forum.